

Graphing is often one of the first ways young children learn to organize information visually. For kindergarten and first-grade students, simple graphing activities provide an important bridge between early counting skills and the more advanced data analysis they will encounter later in their education. When introduced in an age-appropriate, engaging way, graphing helps children make sense of numbers and develop confidence in math.
Building Early Math Foundations
Simple graphing supports several foundational math skills at once. Before a child can interpret a graph, they must first count, compare quantities, and recognize numerals. Graphing activities naturally reinforce these skills by asking students to gather information, count objects, and represent their findings in a clear, visual format.
For young learners, graphing helps:
- Strengthen one-to-one correspondence
- Reinforce number recognition
- Build counting accuracy
- Introduce comparison language such as more, less, and equal
These early experiences lay the groundwork for future success in math.
Making Data Meaningful and Concrete
Graphs help make abstract math concepts more concrete. When children see information represented visually, it becomes easier to understand patterns and relationships. A simple bar graph allows students to quickly see which group has the most, which has the least, and whether any amounts are the same.
Using familiar, child-friendly images—especially seasonal or holiday themes—makes graphing even more meaningful. When students are excited about the content, they are more likely to stay engaged and participate actively in the learning process.
Supporting Critical Thinking and Math Language
Graphing isn’t just about counting; it also encourages students to think critically and talk about math. Asking questions about a completed graph helps children explain their thinking and use math vocabulary in context.
Questions such as:
- How many more are there?
- How many less?
- Are any amounts equal?
- Which category has the most?
help students practice reasoning, comparison, and problem-solving skills in a developmentally appropriate way.
Differentiation Through Graphing Activities
Simple graphing activities can easily be adapted to meet the needs of all learners. Beginning students can focus on coloring, counting, and filling in a basic graph, while more advanced learners can move on to interpreting data and answering questions about the graph.
This makes graphing an excellent tool for whole-group instruction, small groups, math centers, and intervention support.
Seasonal Graphing for Engagement and Motivation
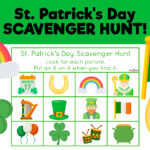
Seasonal and holiday-themed graphing activities add an extra layer of excitement to math instruction. When students work with images they recognize and enjoy—such as pumpkins, hearts, or shamrocks—they are more motivated to participate and practice key math skills.
Seasonal graphing also provides opportunities to connect math to real-world experiences and classroom celebrations throughout the year.
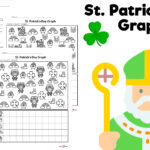
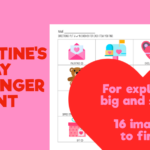
To support early graphing skills in a fun and engaging way, I’ve created seasonal graphing bundles for kindergarten and first grade, including Halloween, Valentine’s Day, and St. Patrick’s Day themes. These worksheets guide students through a color, count, and graph process using a simple grid, making them perfect for introducing graphing concepts.
Each bundle also includes advanced practice worksheets that challenge students to interpret their completed graphs by answering questions about more, less, equal amounts, and which category has the most. These activities are ideal for math centers, whole-group lessons, and independent practice.
You can find these graphing bundles in the Lesson Plan Source (LPS) store, where I continue to add seasonal resources designed to make early math learning both meaningful and fun.


